MAKE THINGS
DIFFERENT.
“Conserve water, conserve life.”
What is it?
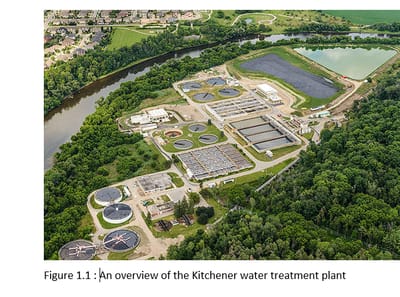
Canada's Source of water
Data provided by the Province of Ontario’s new open data site outlines drinking water sources for 204 municipalities in the province. That data, combined with population figures provided by Statistics Canada, show how many Canadians draw upon which water sources to survive. (Wolfe-Wylie, 2012)
The top five drinking water sources in the province are:
- Lake Ontario: 6.3 million people
- Ottawa River: 943,000 people
- Groundwater spread across the province: 657,000 people
- Lake Erie, Lake Huron: 366,000 people
- Detroit River: 284,000 people
The bottom five drinking water sources in the province are:
- Bay Lake: 387 people
- Lost lake: 476 people
- Killarney Channel: 505 people
- St Joseph’s Channel: 566 people
- Tukanee Lake: 607 people
Water Treatment Process

Collection
The source of water for a municipal surface water treatment plant is typically a local river, lake, or reservoir. The water is transported through a series of pumps and pipelines to the treatment plant. At the water plant, large pumps are used to transfer the water up to the treatment facility. Treatment facilities are often engineered to utilize gravity water flow as much as possible to reduce pumping costs. Many water treatment plants utilize water from more than one source. Blending groundwater with surface water is a method often used to improve the quality of the final product. (Rinkesh, 2016)

Screening and straining
Surfaces water sources such as lakes, rivers, and reservoirs, contain various amounts of suspended and dissolved materials. This material may include turbidity, color, taste, odor, microorganisms, fish, plants, trees, trash, etc. Some of the larger items can impede equipment in the treatment process, so screening or straining out the larger items is a required step. This is often accomplished using a large metal screen, often called a barscreen, which is placed in front of the water source intake. Large items are tapped in the screen as the water passes through it. These screens must routinely be cleaned off. (Rinkesh, 2016)

Chemical Addition
Once the screened source of water is received into the treatment plant, chemicals are added to help make the suspended particles that are floating in the water clump together to form a heavier and larger gelatinous particle, often called floc. In this process, a chemical is added that reacts with the natural alkalinity in solution to form an insoluble precipitate. There are many different chemicals on the market that are used in this process. These chemicals are called coagulants. One of the most common that has been used for many years is aluminum sulfate, or alum. Regardless of which coagulant or combination of coagulants is used, they must be mixed very well with the water before they can form a heavier floc. (Water Treatment, 2015)

Coagulation and Flocculation
A rapid mixing unit is usually used after the coagulant (aluminum sulphate) is added to provide a very quick and thorough mix. As the coagulant meets water, the particles in the water (e.g., natural organic matter, including algae and dissolved organics) will be attracted to each other and allows the organic matter to increase in size, making removal easier. The continued mixing must be gentle to allow the floc to grow and gain weight, but fast enough to keep it in suspension until you are ready for it to settle in the clarifiers. The process of adding a chemical to cause the suspended material to “clump” into larger particles is called flocculation or coagulation. The treatment unit where coagulation and flocculation are performed is called the “flocculator”. ( Hunter Water Corporation, 2019)

Sedimentation and Clarification
As the water and the floc particles progress through the treatment process, they move into sedimentation basins where the water moves slowly, causing the heavy floc particles to settle to the bottom. A rake continuously travels across the bottom of the basin and scrapes the settled floc to the center of the unit. Pumps are used to pull the settled “sludge” (Floc which collects on the bottom of the basin) out of the basin and it is sent to a disposal pond. The water that passes is collected and transferred to the filters. The reason clarification occurs before filtration is so the majority of suspended material can be removed prior to filtration, which avoids overloading the filters and thus allowing much more water to be filtered before the filters must be backwashed. (Hunter Water Corporation, 2019)

Filtration
Water flows through a filter designed to remove particles in the water. The filters are made of layers of sand and gravel, and in some cases, crushed anthracite. Filtration collects the suspended impurities in water and enhances the effectiveness of disinfection. (Hunter Water Corporation, 2019)

Disinfection
Water is disinfected before it enters the distribution system to ensure that any disease-causing bacteria, viruses, and parasites are destroyed. The most common disinfection process is chlorination. Chlorine is a very effective disinfectant and are added to water to ensure all microorganisms are destroyed. Water plants monitor the chlorine levels continuously and very carefully in the treated water. They must add enough chlorine to ensure thorough disinfection of the water but avoid adding excesses that can cause taste and odor problems when delivered to the consumer. (Water Treatment, 2015)

Distribution
So how does the water come out of your kitchen tap? The stored water is pushed through underground pipelines all over town in what is called a “distribution system”. The distribution system consists of large water pumps at the treatment plant, overhead water storage tanks, large pipelines, smaller pipelines, fire hydrants, valves, and water meters in your front yard. (Water Treatment, 2015)
common types of household water treatment systems
Filtration Systems
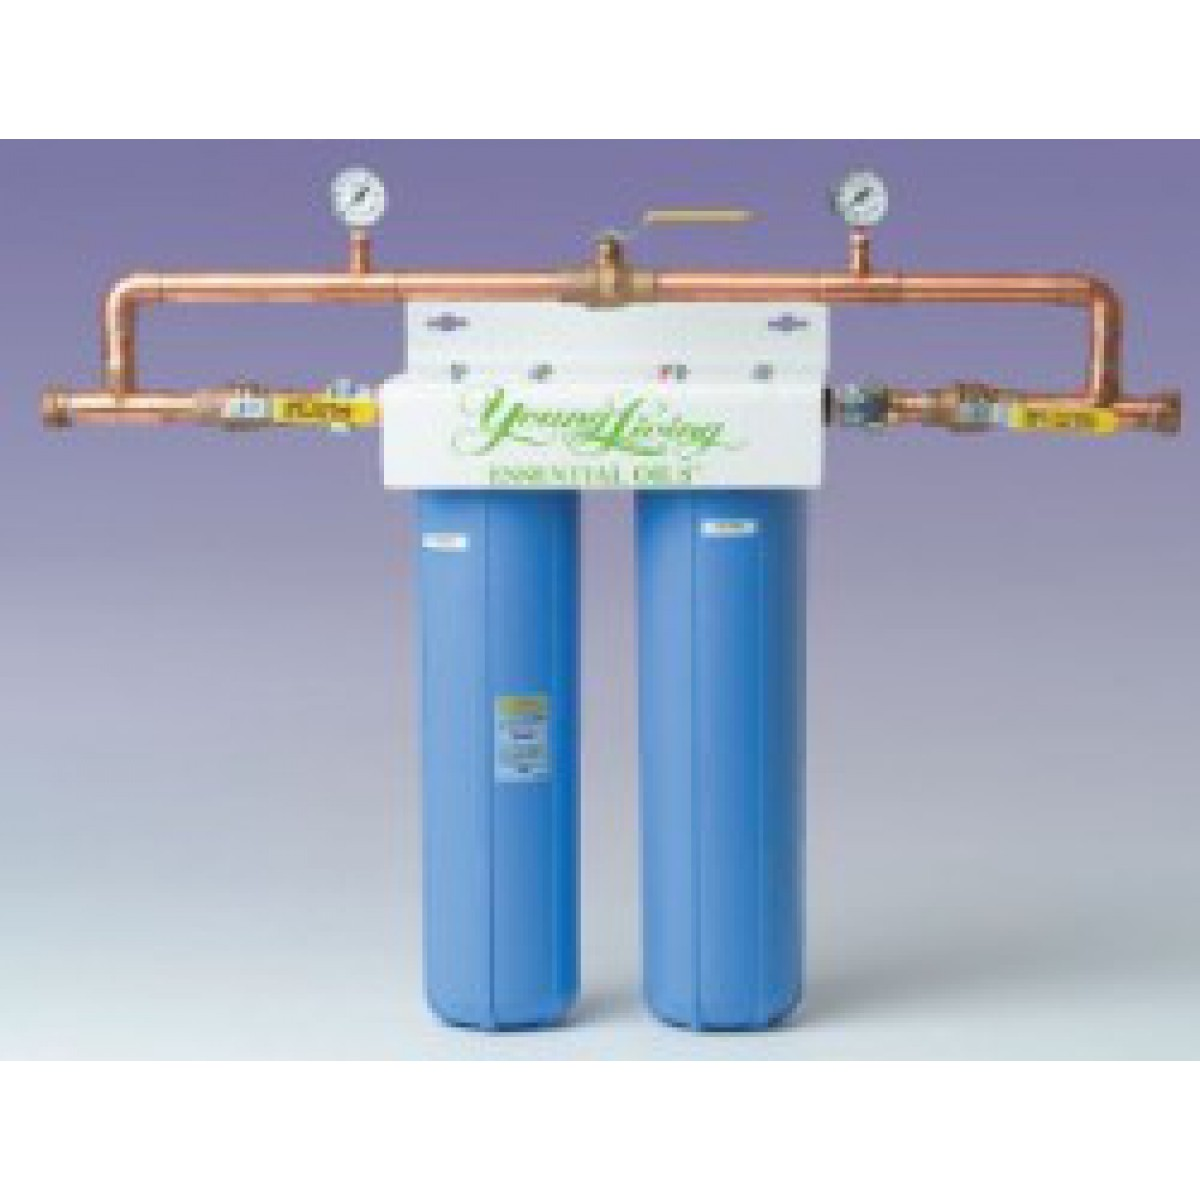 Figure 3.1: House watering system that can be directly contacted you plumbing
Water Softeners
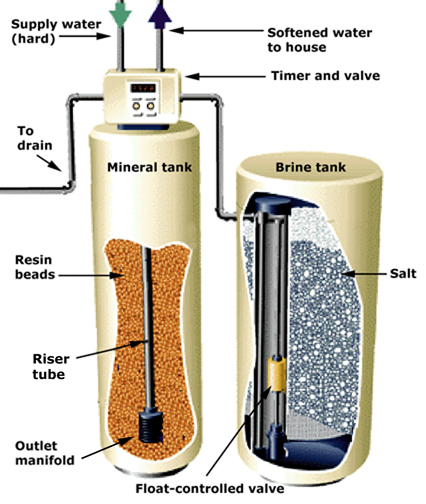
Figure 3.2: As shown in the diagram above, a typical water softener has a resin (or “mineral”) tank, a brine tank, and some type of control. With a conventional cation-exchange water softener, the house water supply pipe is connected to a control valve and timer at the top of the resin tank. (Vandervort, 2019 )
Distillation Systems
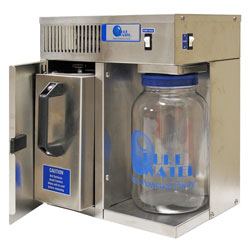 Figure 3.3: This is a nice and compact countertop water distiller .One of the advantages of choosing this unit is that you don’t need to assemble or install it.
Disinfection
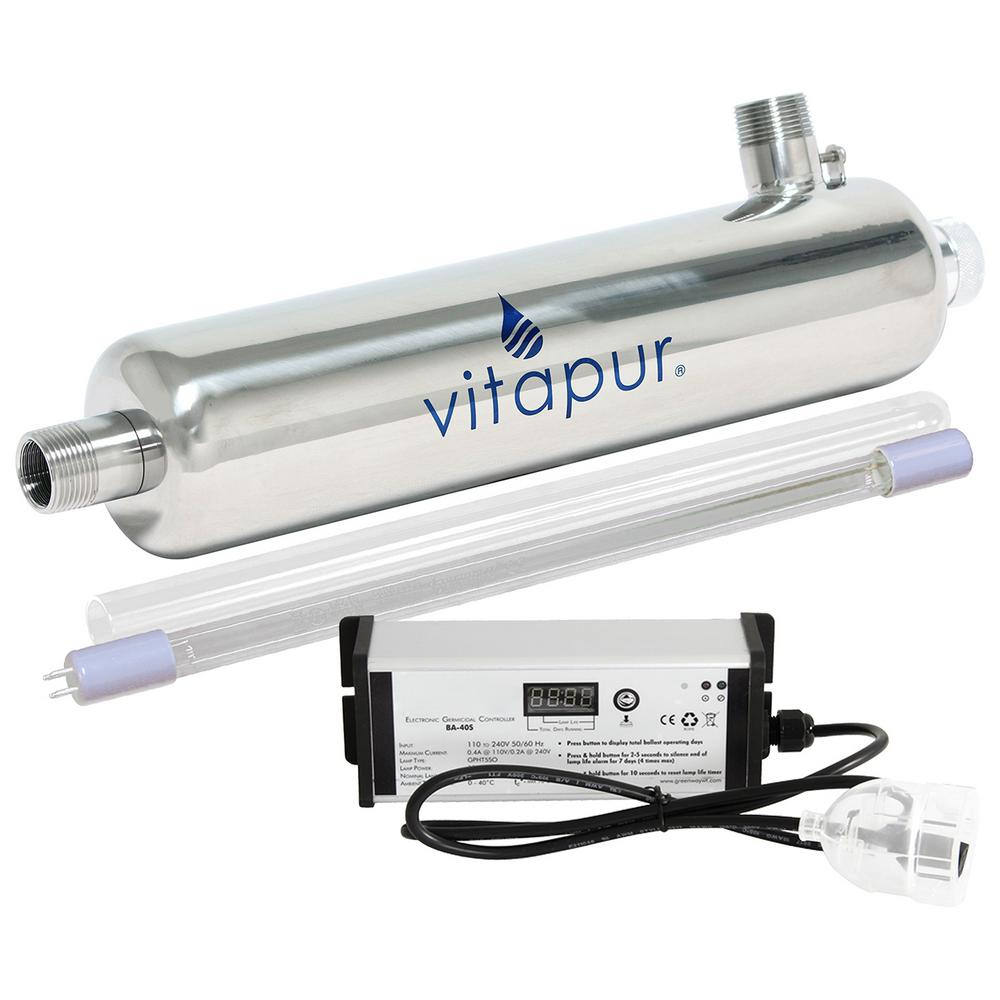 Figure 3.4: Ultraviolet water purification is the most effective method for disinfecting bacteria from the water. Ultraviolet (UV) rays penetrate harmful pathogens in your home's water and destroy illness-causing microorganisms by attacking their genetic core (DNA) (APEC Water Systems, 2017 )
What are the economic costs of building and maintaining water treatment plants?
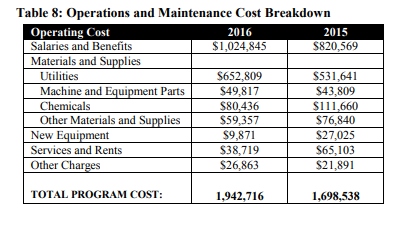
The cost to build a water treatment plant is estimated at $204 million. This includes design, construction and environmental approval costs (Hare, 2017) .The average cost of maintain a treatment is roughly $254,000,000. Plant operations and maintenance costs are broken down into five (5) categories: Salaries and Benefits, Materials and Supplies, New Equipment, Services and Rents and Other Charges. Materials & Supplies is further segregated into Utilities (power and water), Machine and Equipment Parts, Chemicals and Other Materials and Supplies. The total cost of plant operation in 2016 was $1.94M. A breakdown of 2016 annual operations and maintenance costs is shown in Table 8 and illustrated in Figure 1. (North Toronto Water treatment Plant, 2017)
Water quality
Canadian drinking water supplies are generally of excellent quality. However, water in nature is never "pure." It picks up bits and pieces of everything it comes into contact with, including minerals, silt, vegetation, fertilizers, and agricultural runoff. While most of these substances are harmless, some may pose a health risk. To address this risk, Health Canada works with the provincial and territorial governments to develop guidelines that set out the maximum acceptable concentrations of these substances in drinking water. The guidelines set out the basic parameters that every water system should strive to achieve in order to provide the cleanest, safest and most reliable drinking water possible. The Guidelines for Canadian Drinking Water Quality deal with microbiological, chemical and radiological contaminants. They also address concerns with physical characteristics of water, such as taste and odour. (Health Canada, 2017)
Microbiological quality guidelines
The most significant risks to people's health from drinking water come from microscopic organisms such as disease-causing bacteria, protozoa and viruses. The guidelines that relate to these microorganisms are stringent because the associated health effects can be quite severe. They can also affect health over the long-term.
Chemical and radiological quality guidelines
Chemical and radiological substances may also be found in some drinking water supplies but these are generally only a concern if they are present above guideline levels and you are exposed to them over a period of years. New science is showing that exposure to some chemical contaminants above guideline levels may be a concern in the short-term as well.
Aesthetic quality and operational guidelines
Aesthetic quality guidelines address parameters which may affect consumer acceptance of drinking water, such as taste, odour and colour. Operational guidelines are set for parameters that may affect processes at a treatment plant or in the drinking water distribution system. (Government of Canada, 2017)
Environment impact
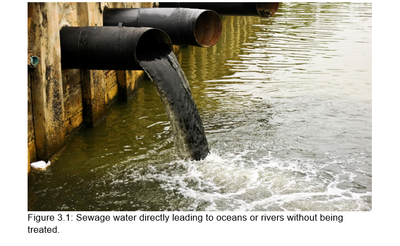
Used water is wastewater. It comes from our sinks, showers, and toilets and from commercial, industrial, and agricultural activities. The term also includes stormwater runoff, which occurs when rainfall carries road salts, oil, grease, chemicals, and debris from impermeable surfaces into our waterways. More than 80 percent of the world’s wastewater flows back into the environment without being treated or reused, according to the United Nations; in some least-developed countries, the figure tops 95 percent. In the United States, wastewater treatment facilities process about 34 billion gallons of wastewater per day. These facilities reduce the amount of pollutants such as pathogens, phosphorus, and nitrogen in sewage, as well as heavy metals and toxic chemicals in industrial waste, before discharging the treated waters back into waterways. But according to EPA estimates, a study showed that more than 850 billion gallons of untreated wastewater are released by sewage treatment systems each year. (Dechak, 2019)
how pollutants enter water system?
Groundwater
When rain falls and seeps deep into the earth, filling the cracks, crevices, and porous spaces of an aquifer (basically an underground storehouse of water), it becomes groundwater—one of our least visible but most important natural resources. Nearly 40 percent of Americans rely on groundwater, pumped to the earth’s surface, for drinking water. For some folks in rural areas, it’s their only freshwater source. Groundwater get polluted when contaminants such as pesticides and fertilizer to waste leached from landfill make their way into aquifer, rendering it unsafe for human as shown in figure 4.1. Ridding groundwater of contaminants can be difficult to impossible, as well as costly. Once polluted, an aquifer may be unusable for decades, or even thousands of years. Groundwater can also spread contamination far from the original polluting source as it seeps into streams, lakes, and oceans. (Groundwater Contamination, 2019)

Figure 4.1 : The water is polluted due to pesticide contamination that enter through the soil.
Surface water
Covering about 70 percent of the earth, surface water is what fills our oceans, lakes, rivers, and all those other blue bits on the world map. Surface water from freshwater sources (that is, from sources other than the ocean) accounts for more than 60 percent of the water delivered to American homes. But a significant pool of that water is in peril. According to the most recent surveys on national water quality from the U.S. Environmental Protection Agency, nearly half of our rivers and streams and more than one-third of our lakes are polluted and unfit for swimming, fishing, and drinking. Nutrient pollution, which includes nitrates and phosphates, is the leading type of contamination in these freshwater sources. While plants and animals need these nutrients to grow, they have become a major pollutant due to farm waste and fertilizer runoff. Municipal and industrial waste discharges contribute their fair share of toxins as shown in figure 4.2. There’s also all the random junk that industry and individuals dump directly into waterways. (Water treatment, 2017)
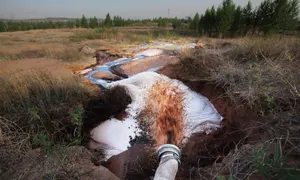
Figure 4.2: Many industrial dispose there toxic waste into near by lake and rivers.
Ocean water
Eighty percent of ocean pollution (also called marine pollution) originates on land—whether along the coast or far inland. Contaminants such as chemicals, nutrients, and heavy metals are carried from farms, factories, and cities by streams and rivers into our bays and estuaries; from there they travel out to sea. Meanwhile, marine debris—particularly plastic—is blown in by the wind or washed in via storm drains and sewers. Our seas are also sometimes spoiled by oil spills and leaks—big and small—and are consistently soaking up carbon pollution from the air. The ocean absorbs as much as a quarter of man-made carbon emissions. (American Rivers. 2019)

Point source
When contamination originates from a single source, it’s called point source pollution. Examples include wastewater (also called effluent) discharged legally or illegally by a manufacturer, oil refinery, or wastewater treatment facility, as well as contamination from leaking septic systems, chemical and oil spills, and illegal dumping. The EPA regulates point source pollution by establishing limits on what can be discharged by a facility directly into a body of water. While point source pollution originates from a specific place, it can affect miles of waterways and ocean. (Groundwater Contamination, 2019)
Nonpoint source
Nonpoint source pollution is contamination derived from diffuse sources. These may include agricultural or stormwater runoff or debris blown into waterways from land. Nonpoint source pollution is the leading cause of water pollution in U.S. waters, but it’s difficult to regulate, since there’s no single, identifiable culprit. (Groundwater Contamination, 2019)
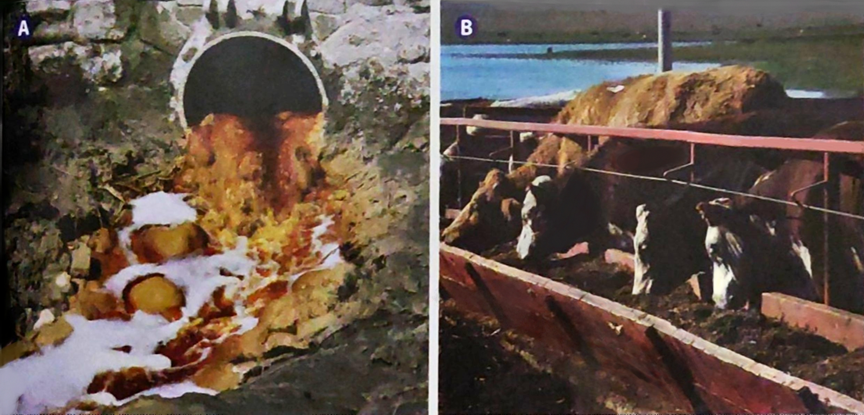
Figure 4.3: (A) point source: Wastewater from factories are polluting the water.
(B) Non-point source: runoff water from farm that contain fertilizer travel to nearby waterways.
Transboundary
It goes without saying that water pollution can’t be contained by a line on a map. Transboundary pollution is the result of contaminated water from one country spilling into the waters of another. Contamination can result from a disaster—like an oil spill—or the slow, downriver creep of industrial, agricultural, or municipal discharge. (American Rivers. 2019)
.
Minimizing Environmental Impacts of Water Purification
Carbon Footprint
As a holistic approach to ‘environmental impact’, an online carbon footprint calculator has been set up to estimate the carbon footprint for each product (and combination of products) for their full lifetime. It takes into account the estimated water usage, consumables, accessories, product delivery, number of services required as well as an assessment of the transport mode. This approach allows for the comparison of different products and identifies the steps which produce most carbon so that alternative solutions can be considered.(Whitehead, 2015)
Operational Aspects of Water Treatment Systems
The water treatment technologies selected will have a major impact on water and power usage though-out the life of a water purification system. Each consumable will have a carbon footprint and there will also be a footprint for any service visits. Overall the objective is to maximise the lifetime of components and the reliability of the system, hence to minimize service visits. Other operational aspects include the reduction of power usage by 5% per product and reducing the product waste water by 12% per unit. (Whitehead, 2015)
Production and Distribution of Water Purification Systems
In manufacturing and production, the choice and types of component used and their suppliers, and the use of energy-efficient and/or water-efficient techniques all lead to reduced environmental impact directly, and to reduced service call-outs through increased product reliability. In addition, the following factors are also taken into consideration: localized distribution centres, lower carbon sea rather than air transport and reduced product packaging.(Whitehead, 2015)
How it relates to chemistry
Chemistry's Role
Example of chemical reaction

Net ionic equation:

pH Correction
Molar Concentration
m= 1.5g
converted into moles
n= 0.028mol
V=1L
M=?
c=n/V
=0.028 mol / 1L
=0.0.28M
Therefore there is a concentration of 0.028 mole/L


